Dashboards provide insights into data across the organization. In this article, we explain the full workflow for accessing and utilizing the dashboards that live under the Analytics tab in your Deel account.
Five main dashboards are currently available: People, Compensation, Time Off, Diversity, Equity & Inclusion (DEI), and Immigration.
• The People dashboard tracks headcount, attrition, growth and other workforce-focused metrics. • The Compensation dashboard shows what the company is paying workers across locations, job types and more. • The Time Off dashboard highlights how paid-time-off is being requested and used. • The DEI dashboard aggregates diversity, equity and inclusion data, such as compensation gaps and gender distribution.
In This Article
Dashboards: People, Compensation, Immigration Time Off, and DEI
How to Access Dashboards
Overview
Follow the steps below to open the Analytics area and launch any dashboard.
• Expected outcome: The chosen dashboard opens and displays real-time charts and metrics. • Estimated time to complete: 2-3 minutes.
Prerequisites
- Your Deel role must include permission to view the Analytics section.
If you do not see Analytics after Step 1, contact your Deel administrator.
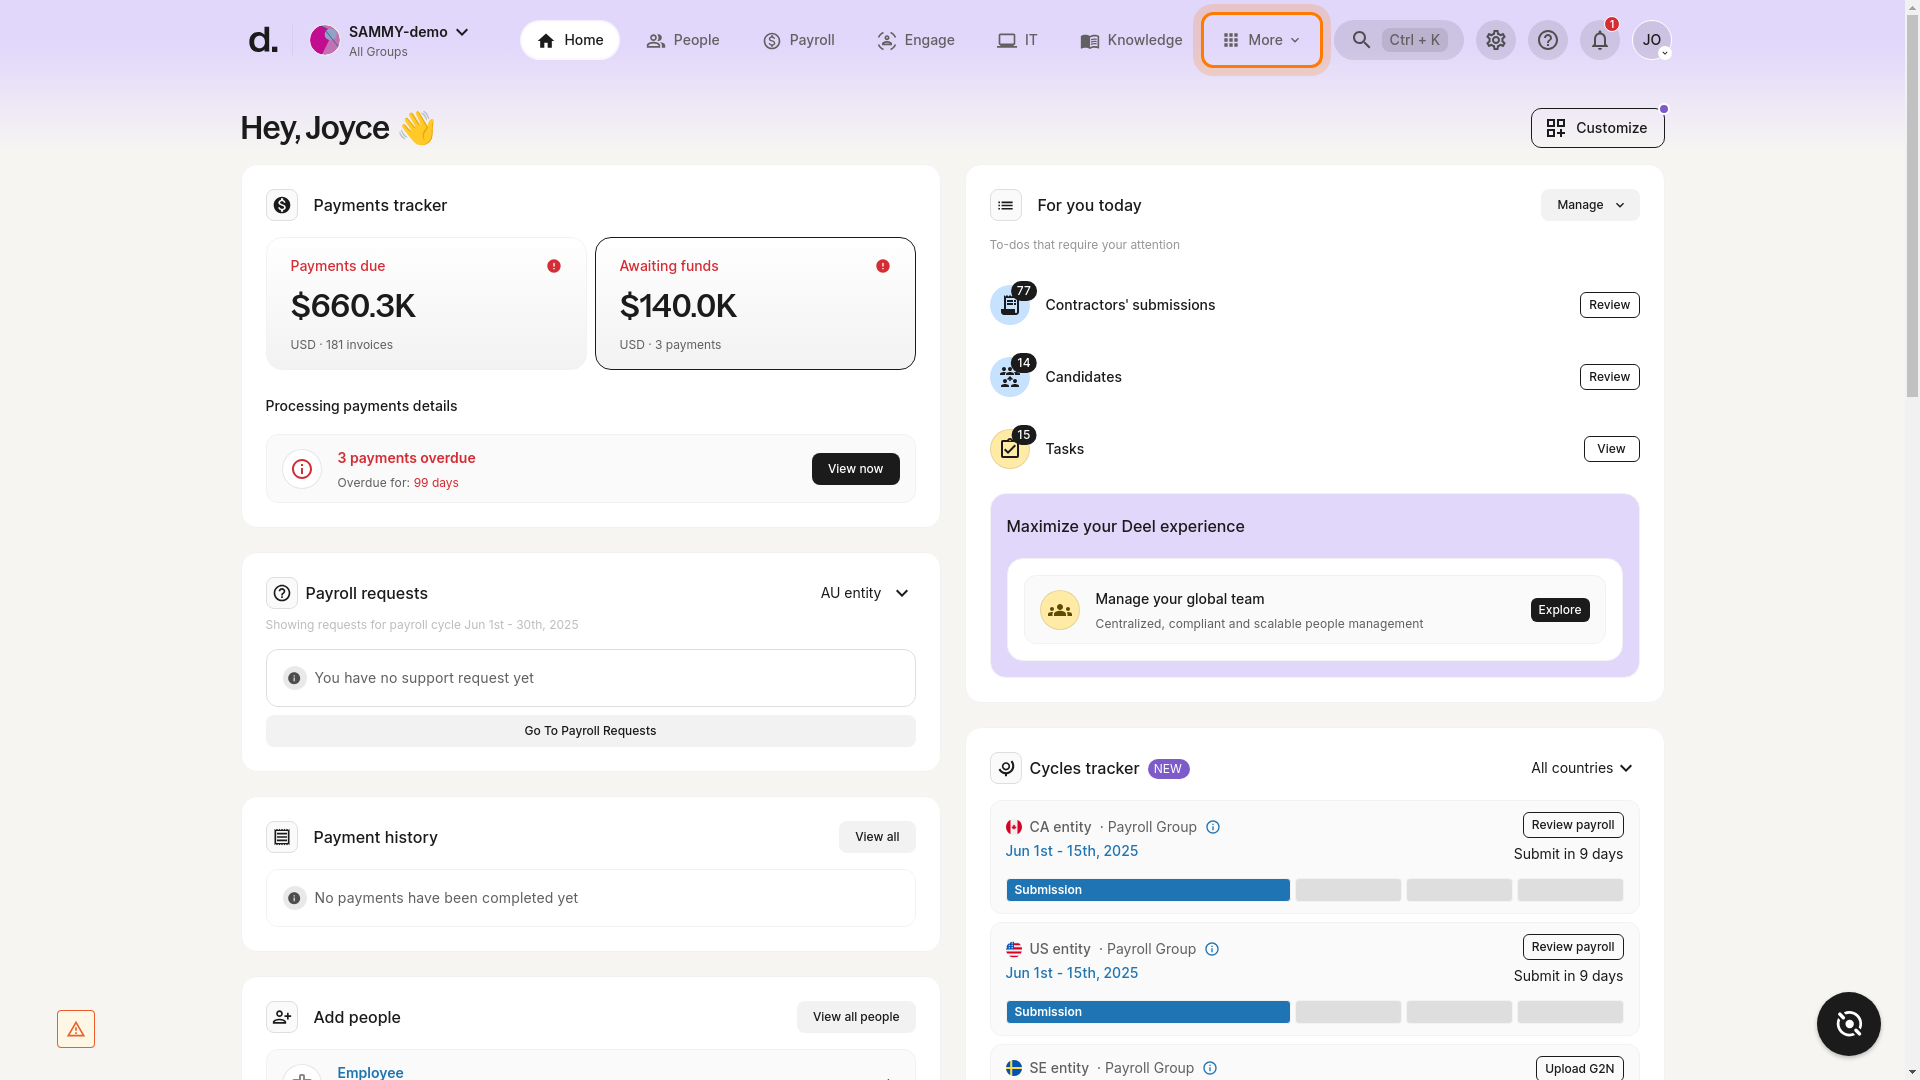
✅ Step 1 – Open the More icon
From the Deel home page, click the More tab in the top navigation bar to reveal additional products and services.
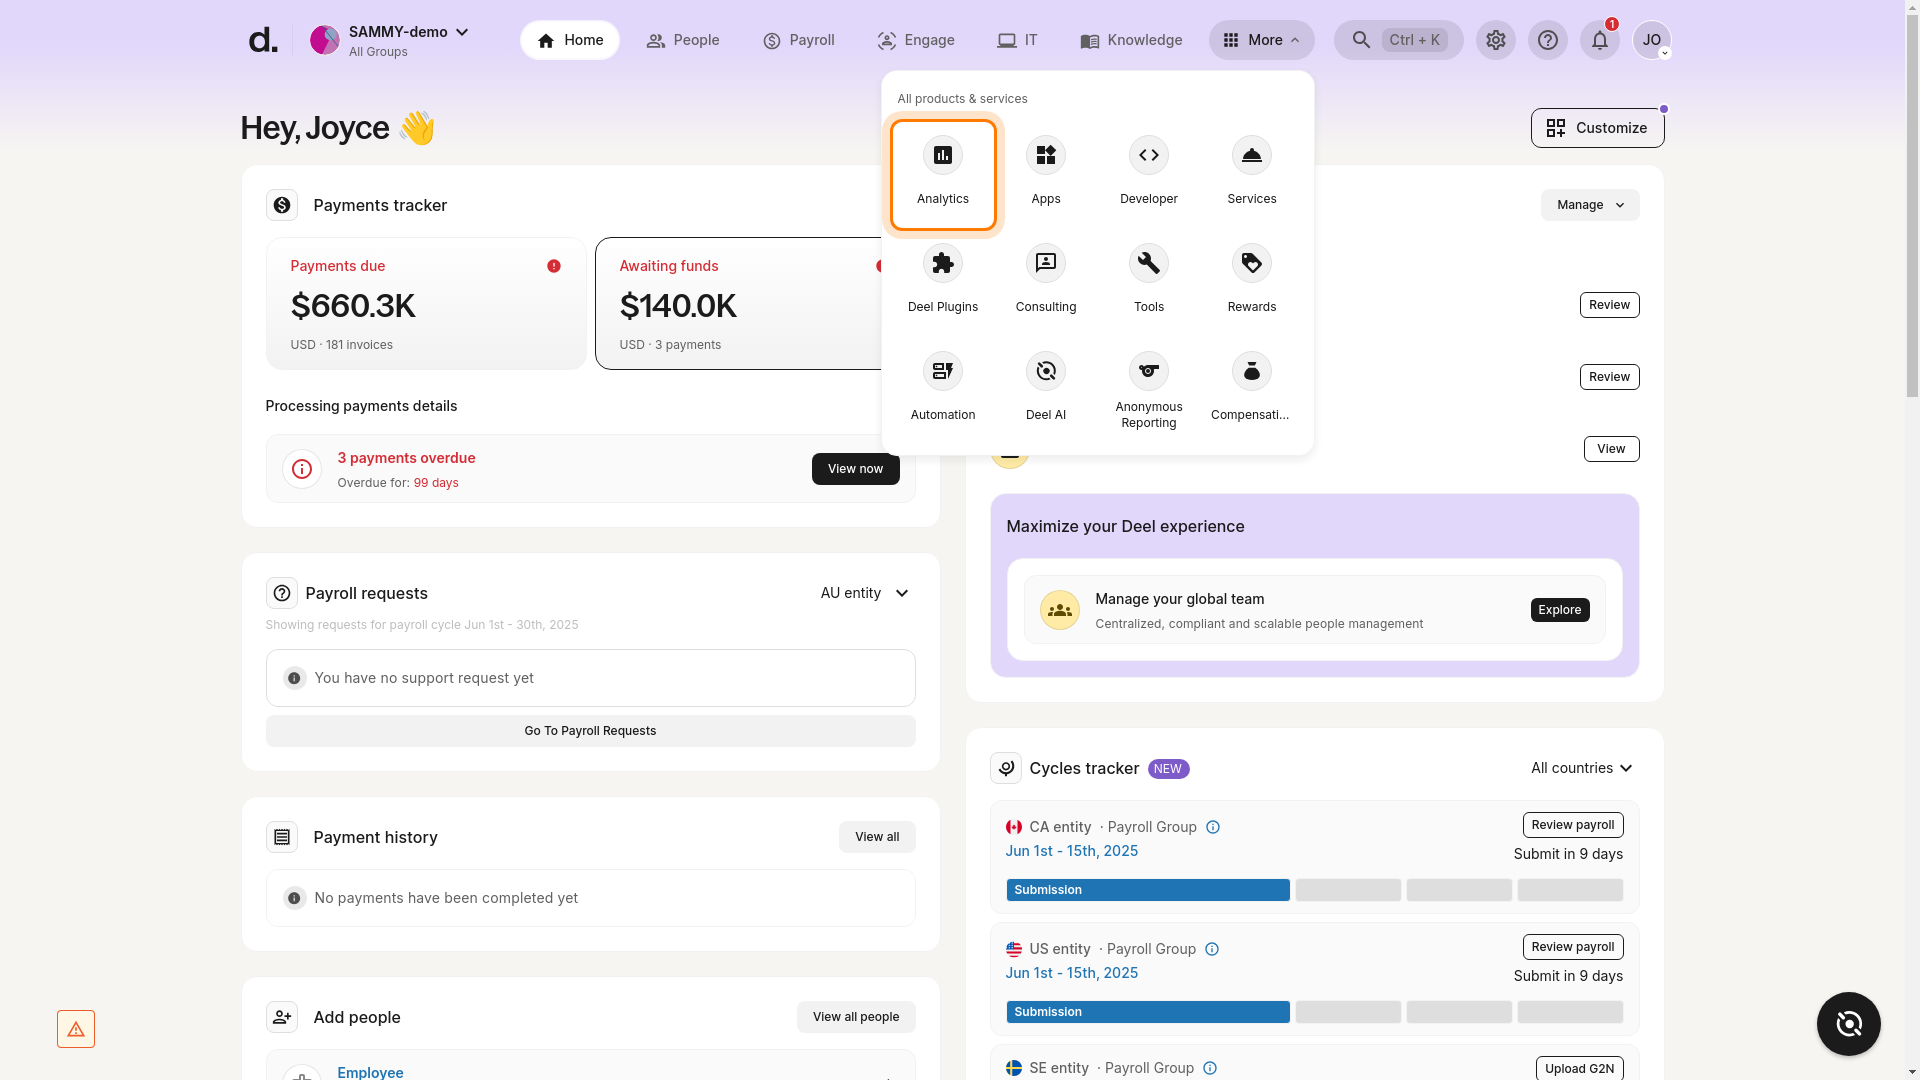
✅ Step 2 – Select Analytics
In the drop-down, click the Analytics tile. You will be taken to the Analytics area, which opens on the Dashboards tab by default.
✅ Step 3 – Locate the desired dashboard
All available dashboards are listed (People, Compensation, Time Off, DEI). Scroll if needed and find the dashboard you wish to open.
✅ Step 4 – Click View dashboard
Press View dashboard on the card for the dashboard you want to review.
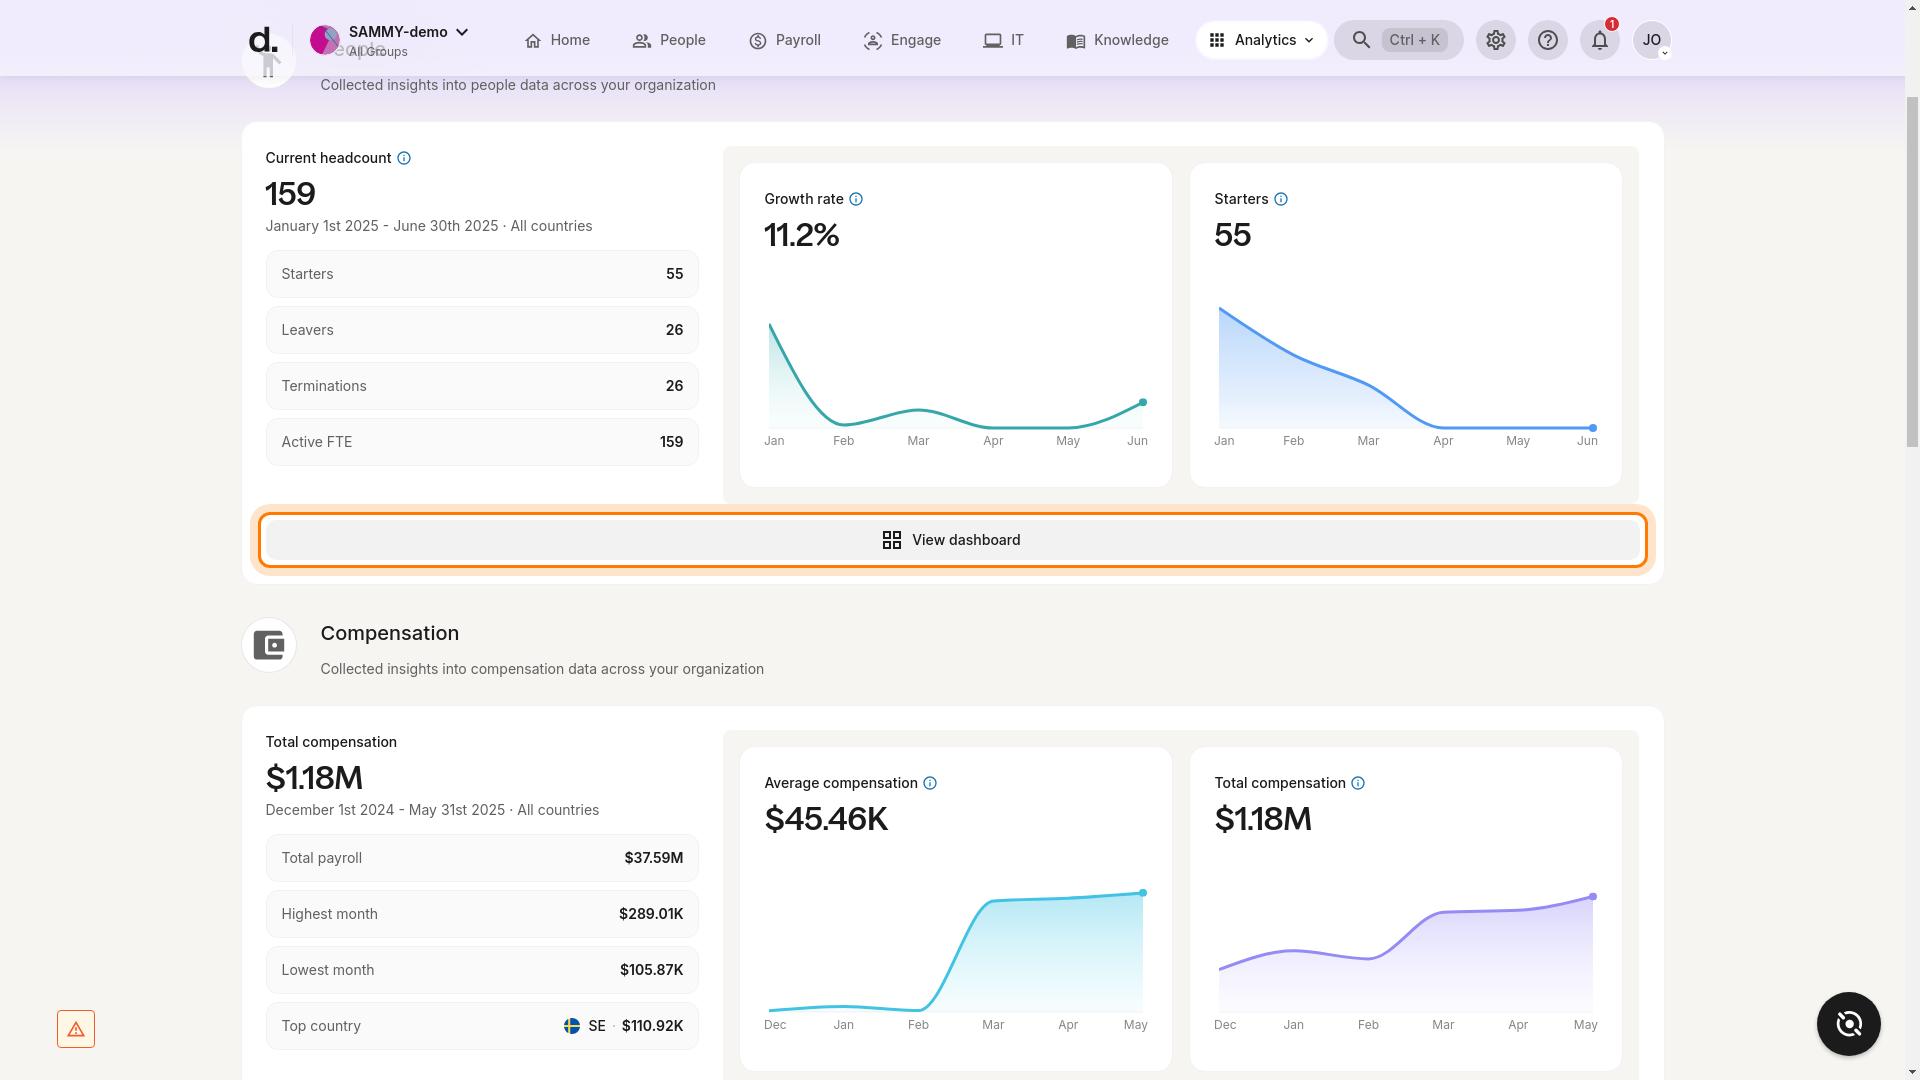
✅ Step 5 – Review and interact with the dashboard
The dashboard loads with key metrics and visualisations. Use the filters at the top (date range, groups, countries, worker type, etc.) to refine the information shown.

Success criteria
✓ The selected dashboard is fully loaded.
✓ Metrics and charts (e.g. headcount, growth rate) are visible.
✓ Filters and interactive elements respond as expected.
Troubleshooting
- Analytics option missing: Confirm you have the required permissions; otherwise, ask your Deel admin.
- Dashboard doesn’t load: Refresh the page, clear cache, or try another browser.
- Unexpected data: Check your filter selections to ensure the correct time period, group or country is applied.
Tips
- Hover over charts for additional tool-tips.
- Need a different dashboard? Click the Analytics breadcrumb at the top and pick another card.
- Use Save report (where available) to store custom views for quick reuse.
Dashboards: People, Compensation, Time Off, Immigration, and DEI
Click a section below for details on what each dashboard contains and how to drill deeper into its data.
[ACCORDION] People
The People dashboard provides insights on workforce trends in nine categories: Headcount, Growth Rate, New Joiners, Leavers, Turnover Rate, Retention Rate, Worker-to-Manager Ratio, Average Tenure and Attrition Rate.
- Apply the (1) filters at the top (date, groups, countries, contracts) to narrow data.
- Click (2) View Details under any card for a detailed report.
In a detailed report you can: * Add (1) additional filters for deeper slicing. * (2) Save report to create a reusable custom view. * (3) Download the current view to CSV or PDF.
[ACCORDION] Compensation
The Compensation dashboard highlights pay trends and is grouped into six categories: Total Compensation, Total Payroll, Compensation by Country, Compensation by Job Type, Average Compensation and Age Pay Gap.
Use the filters (date, groups, countries, contracts, job titles, currency) to tailor results. Data refreshes instantly when filters change.
[ACCORDION] Time Off
The Time Off dashboard tracks leave behaviour across two key metrics: Average time off taken and Time-off requests approved vs. declined.
Filters available: date range and location.
[ACCORDION] Diversity, Equity & Inclusion
The DEI dashboard aggregates diversity metrics across four areas: Average Compensation, Headcount by Gender, Gender Over Time and Attrition.
Filters include gender, time period, job title, country, contract type, currency and more.
[ACCORDION] Immigration
The Immigration dashboard provides a holistic view of immigration activity across your organization, covering the full lifecycle of managing non-national workers, from active cases and compliance tracking to immigration costs and business visa reporting.
What it covers
Immigration cases (active and historical outcomes)
Compliance status and document expiry tracking
Immigration costs, including historical and projected spend
Business visa activity (where available)
Filters available
Depending on the report, you can filter by:
Date range
Case status and case country
Employment country
Visa type, visa category, and work type
Worker type and citizenship
Business unit or entity
Assignee (case owner)
Compliance status and document type
Expiration date range
Invoice details (where applicable)
Visuals included
The dashboard includes both table-based reporting and visual insights, such as:
Case volumes by stage, country, and time period
Average processing time by case type
Case outcomes (approval/denial/RFE)
Compliance risk by country and visa type
Cost breakdowns by country and visa type
Business visa trends, such as top travel destinations
Limitations
Some fields may not be available depending on your configuration and data source. For example, business visa expiry dates may not yet be supported in all reporting views.