
This article explains how clients can easily create customized reports and share them with others in the organization.
In this article:
How to group columns in report view
How to create a custom report
✅ Step 1 – Open Analytics Reports
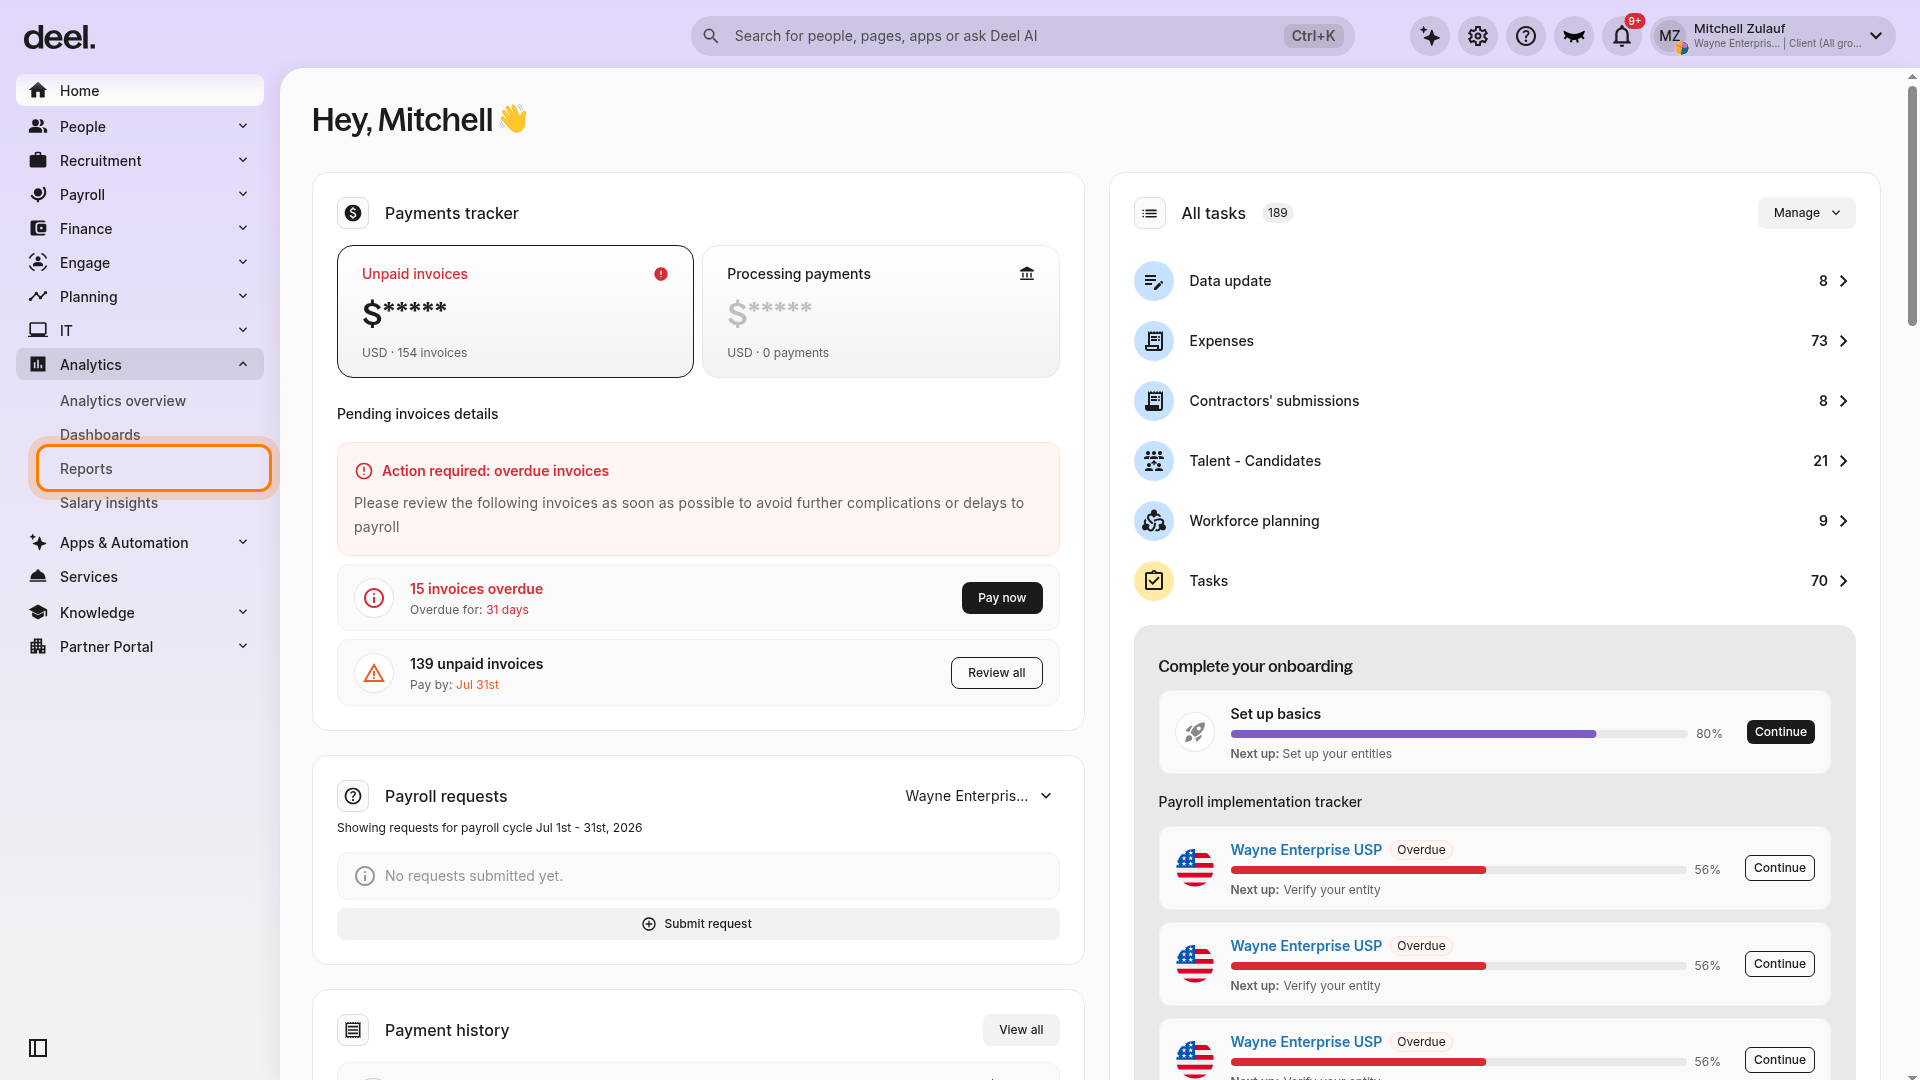
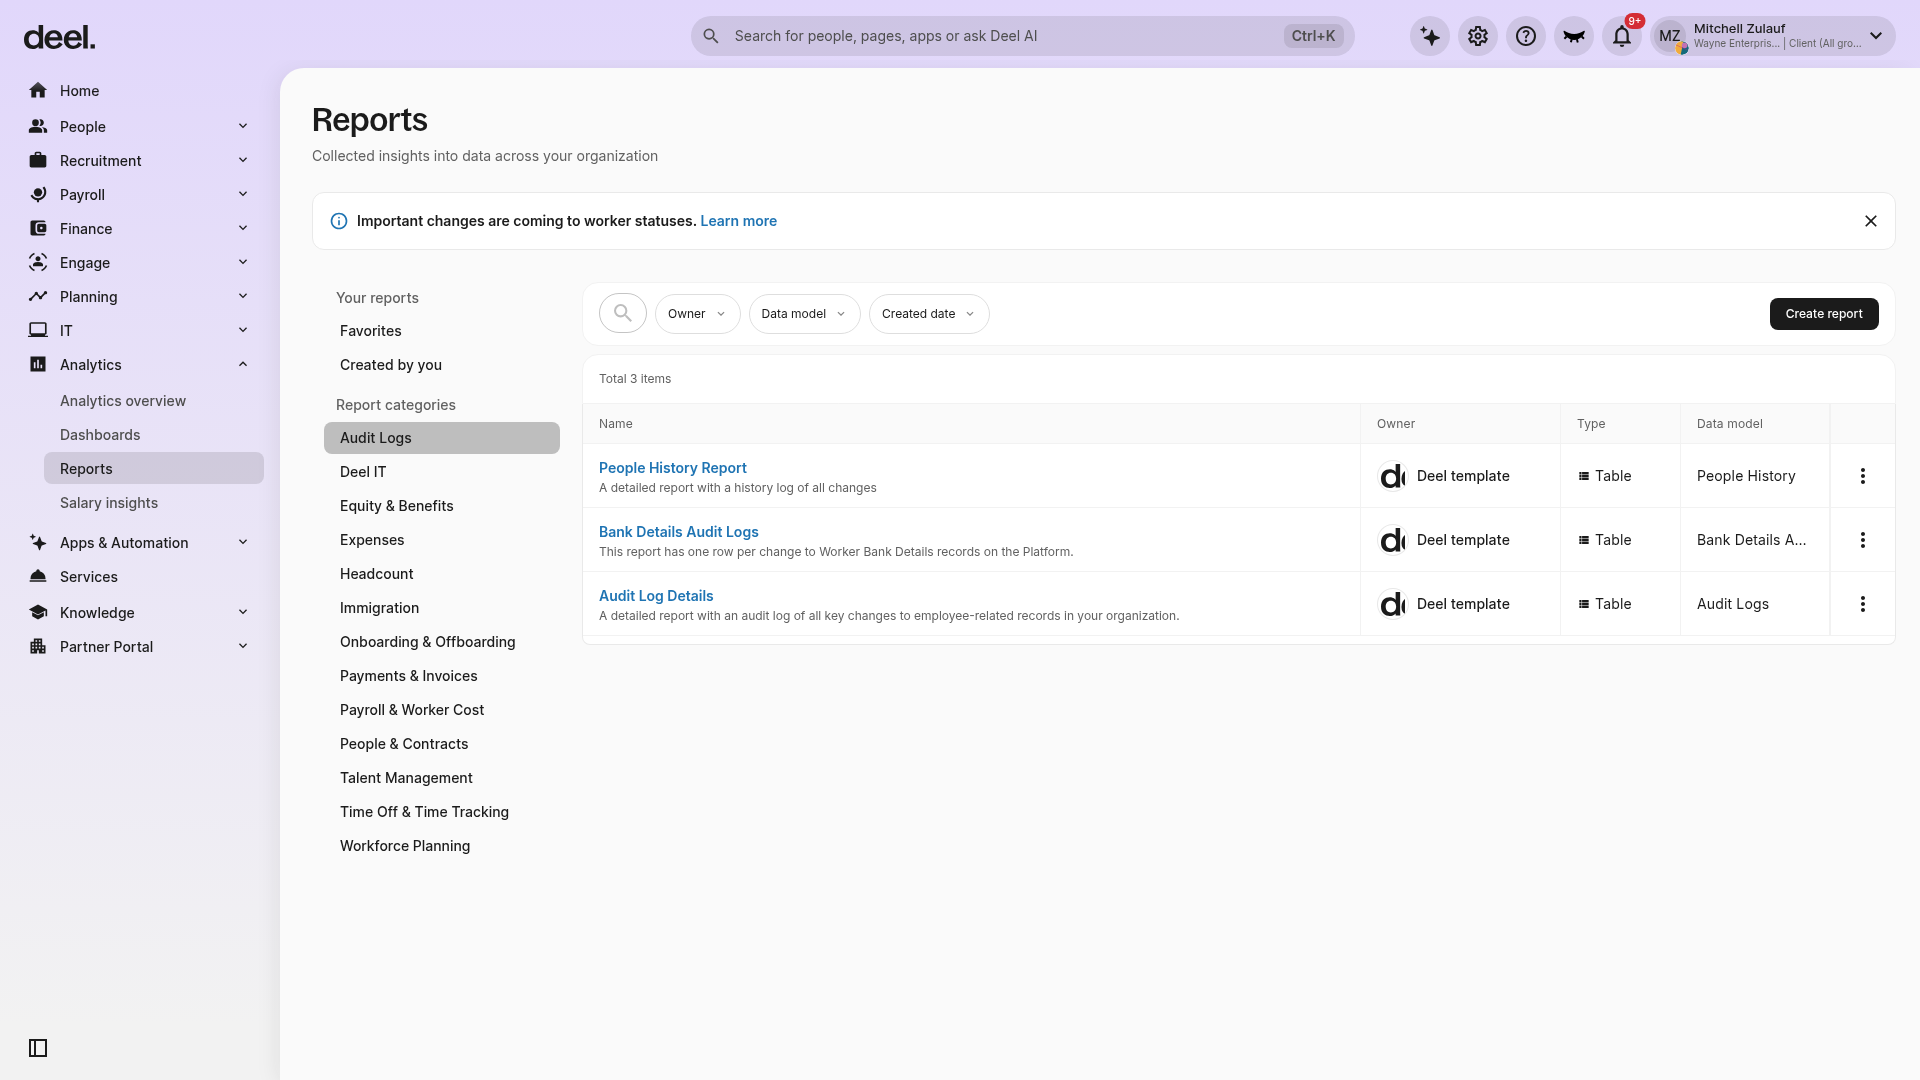
In the left sidebar, click Analytics to expand its submenu, then select Reports. Confirm that the page heading reads Reports and that the page includes report search or filter controls and a Create report button.

✅ Step 2 – Create a report
Click Create report. The clients can create a new report from scratch by selecting columns and filters, or customize an existing report by selecting the Custom button below the desired template.
✅ Step 3 - Select the Report type
Clients can choose whether they want to create a report and save it to the Dashboard or create a One-time report that will not be saved in the dashboard.
If a report is created from scratch, the system will additionally prompt the client to select a primary object for their report.
Clients can also choose a second-primary/base object to build their report on.
✅ Step 4 - Select Report columns and Filter
Select the report columns to display and the applicable filter type for your report.
Clients can also select if they want to share the report with others in their organization.
Review the details and Click on Finish.
How to Share a Custom Report
While creating a custom report, clients can also share the report with others in their organization.
✅ Step 1 - Select Share with others
After clicking on Create report, select the report type, primary object, report columns, and filters. Sharing is available only for reports saved to the dashboard.
Select Share with others while entering report details in Step 4 above.
✅ Step 2 - Select Recipients
Reports automatically filter content based on the viewer’s role. Recipients will only see data permitted by their specific user permissions as defined by your Org Admin.
Clients can also choose to share the report with entire groups or departments within the organization. Learn more about groups here.
Review the Information and click on Finish.
How to Group Columns in the Report View
Clients can group and customize the columns within input and output reports to better interpret the data.
✅ Step 1 - Select the report
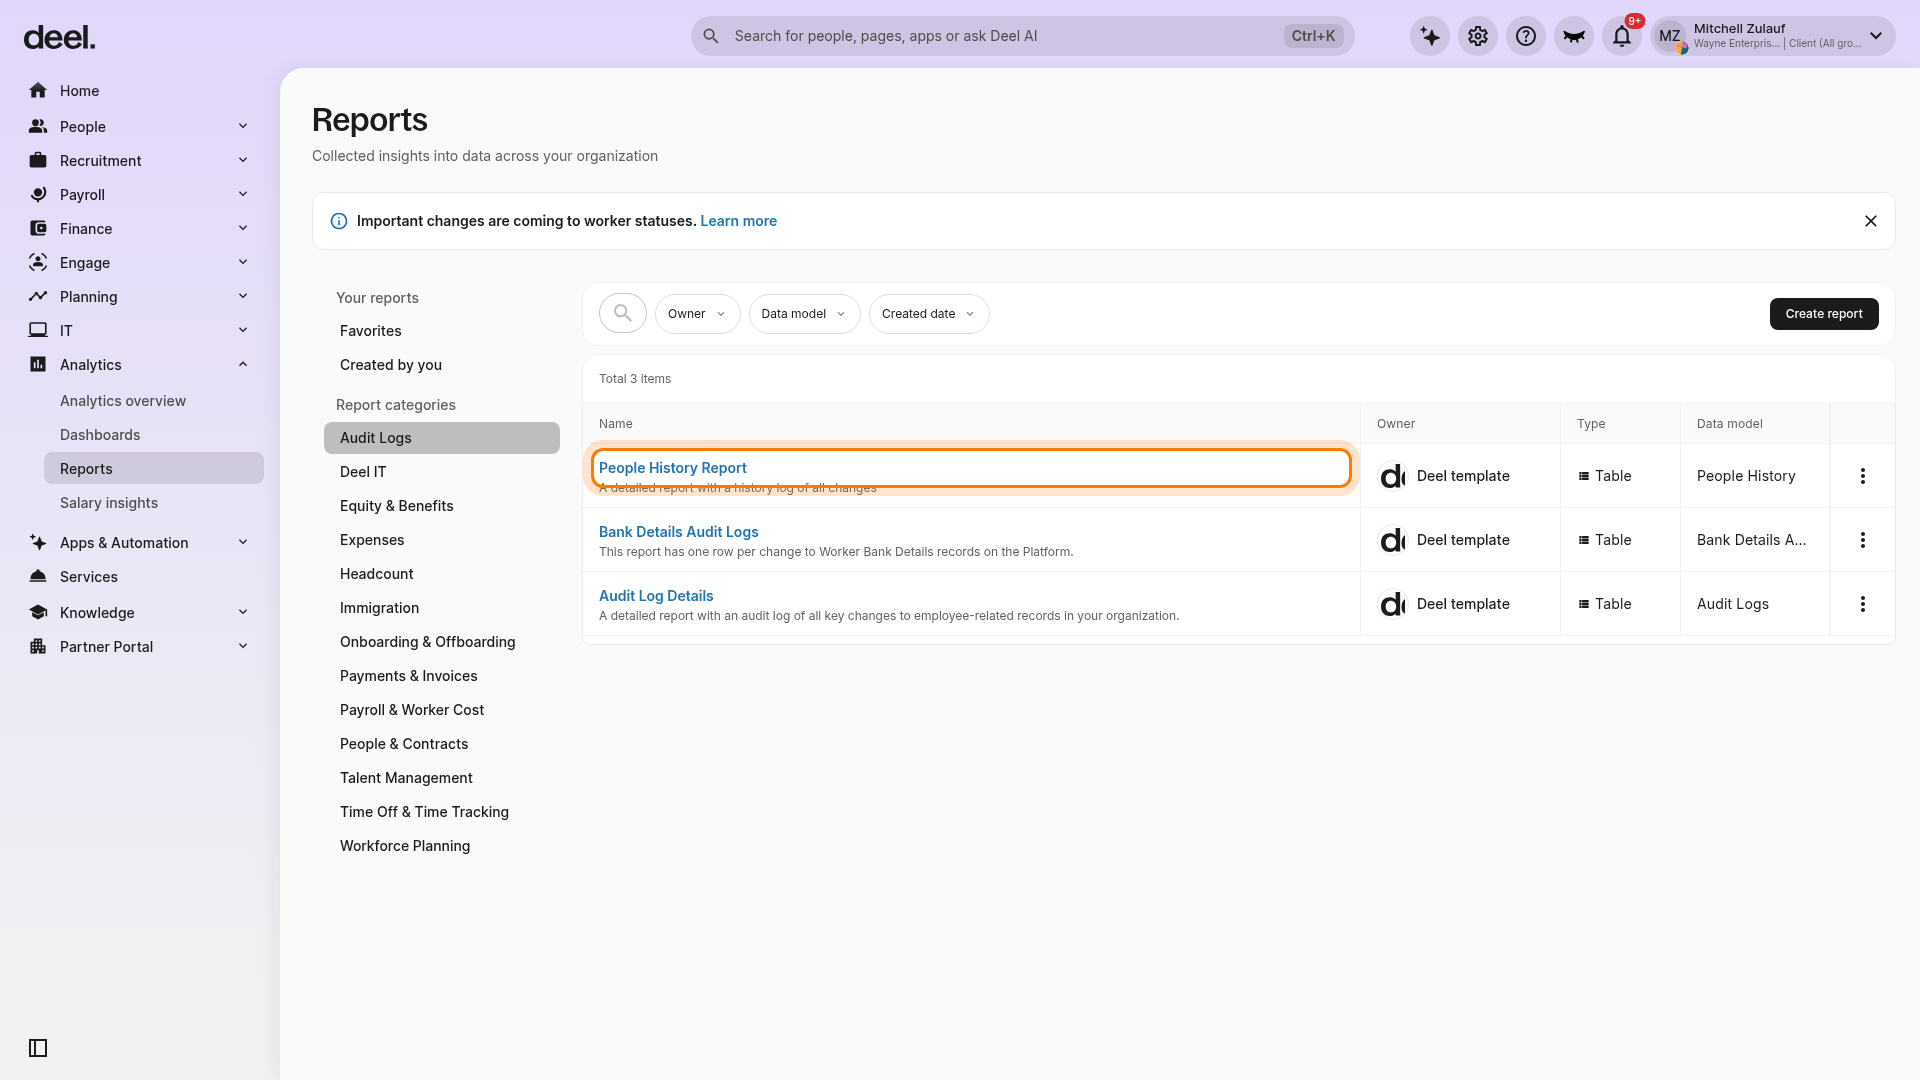
From Analytics > Reports, select the name of the report you want to edit. If your interface displays a View action beside the report, select View instead.
Wait for the report builder to load. The report is already in edit mode when controls such as Filters, Available fields, Added fields, Run, and Save are visible.
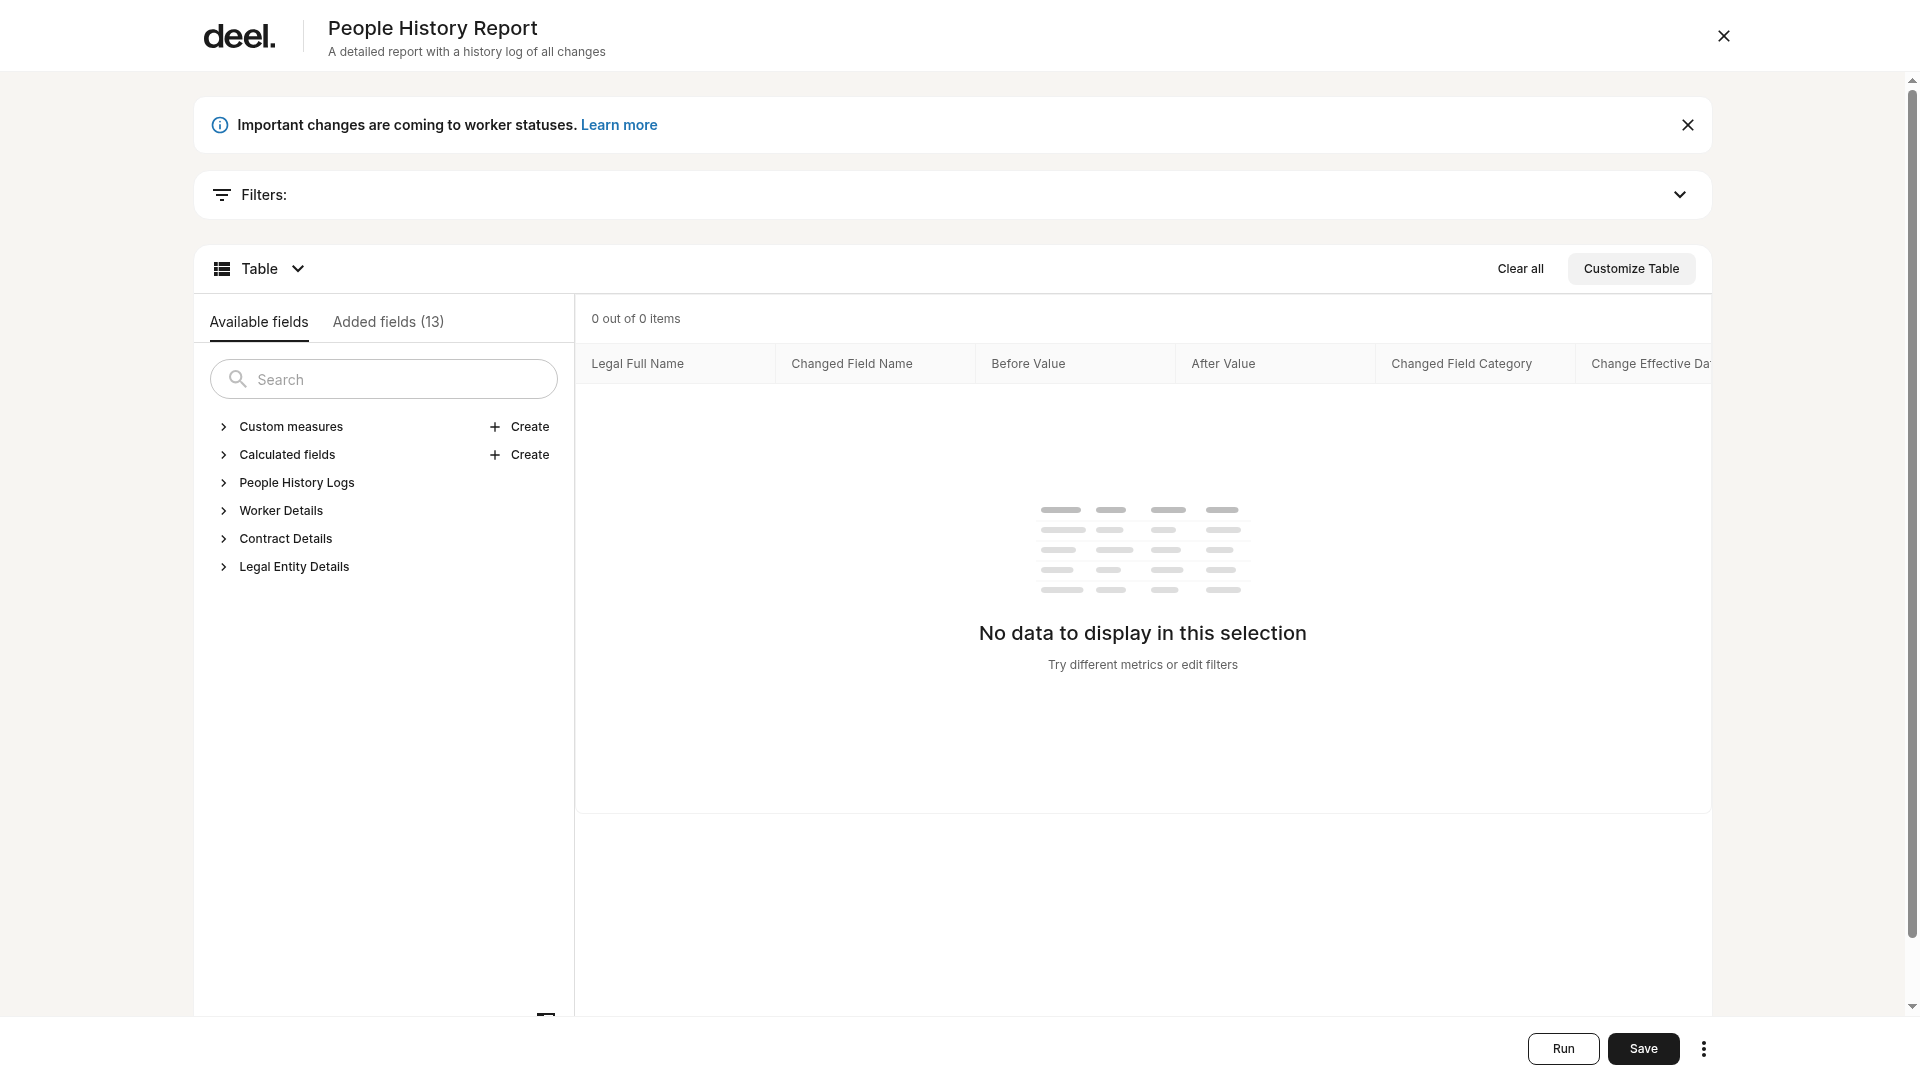
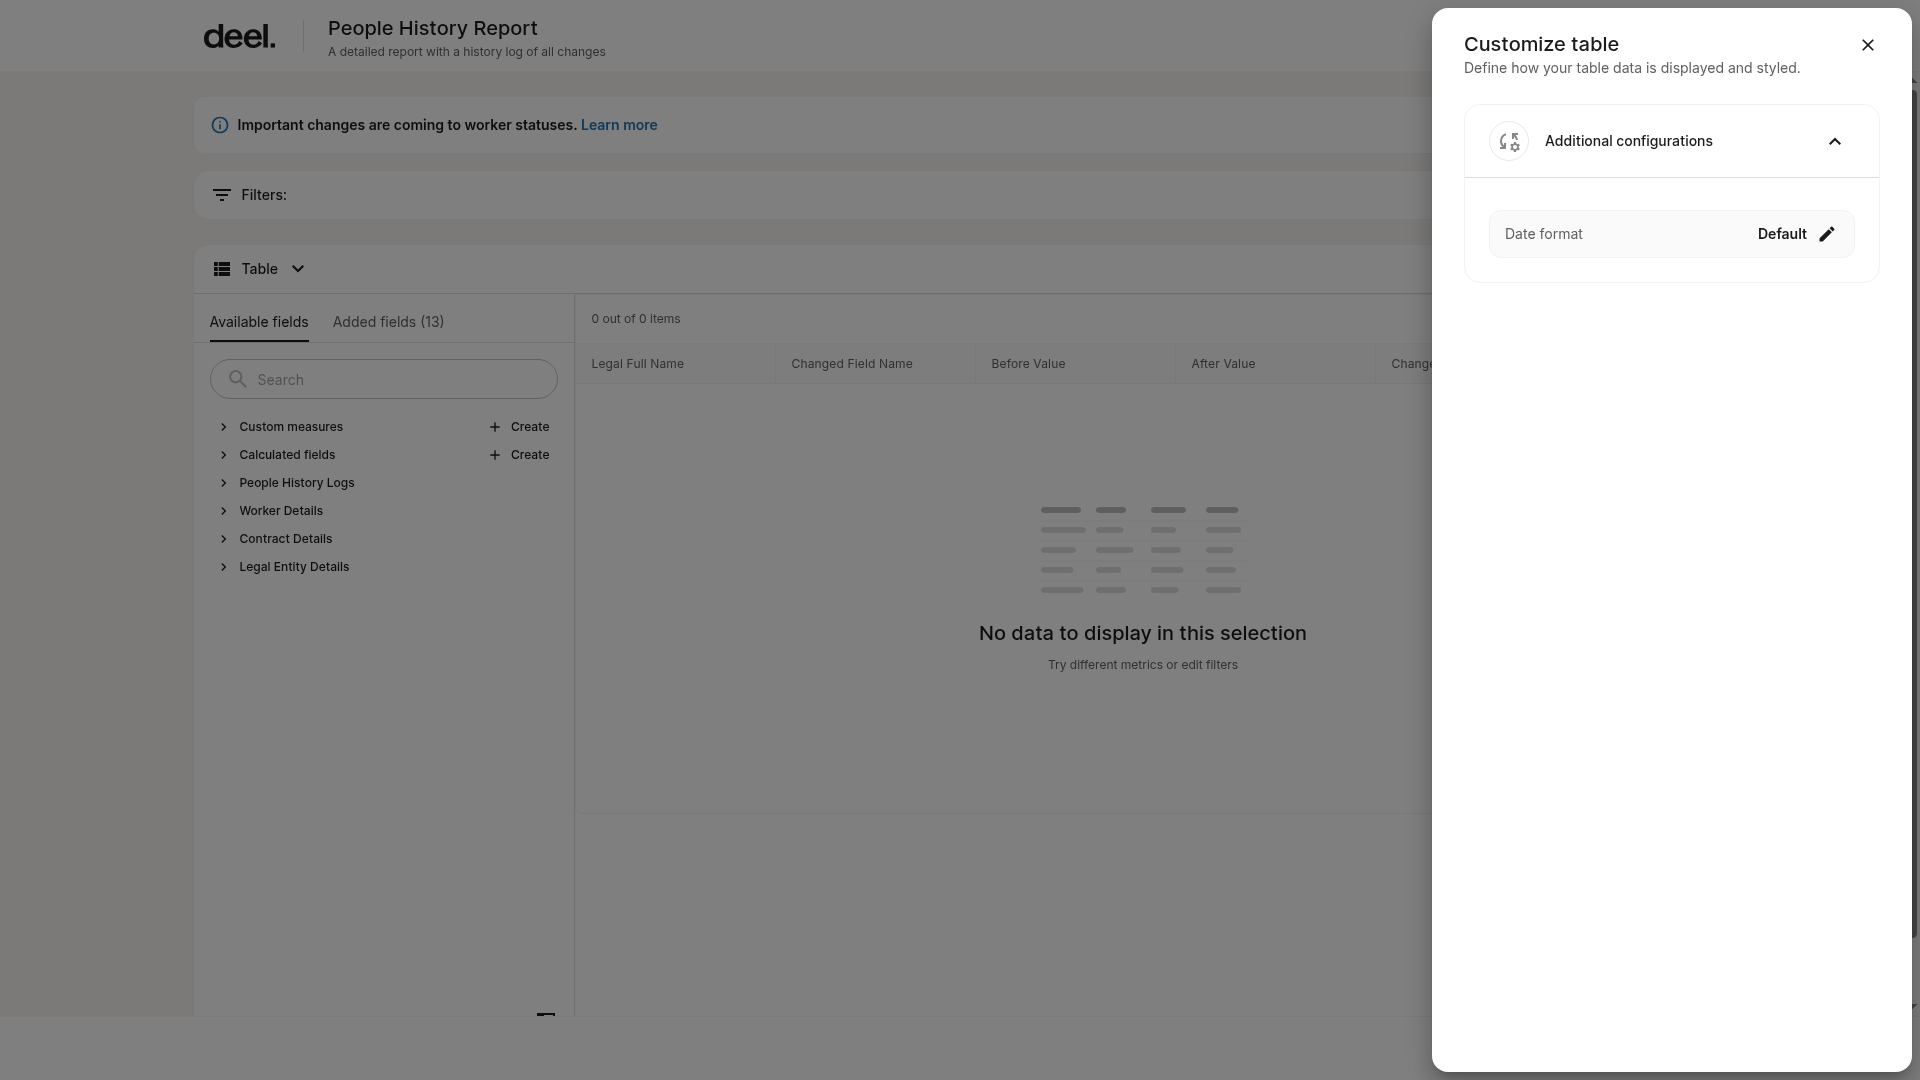
In the upper-right area of the report table, click Customize Table. This is the current equivalent of Configure Columns.
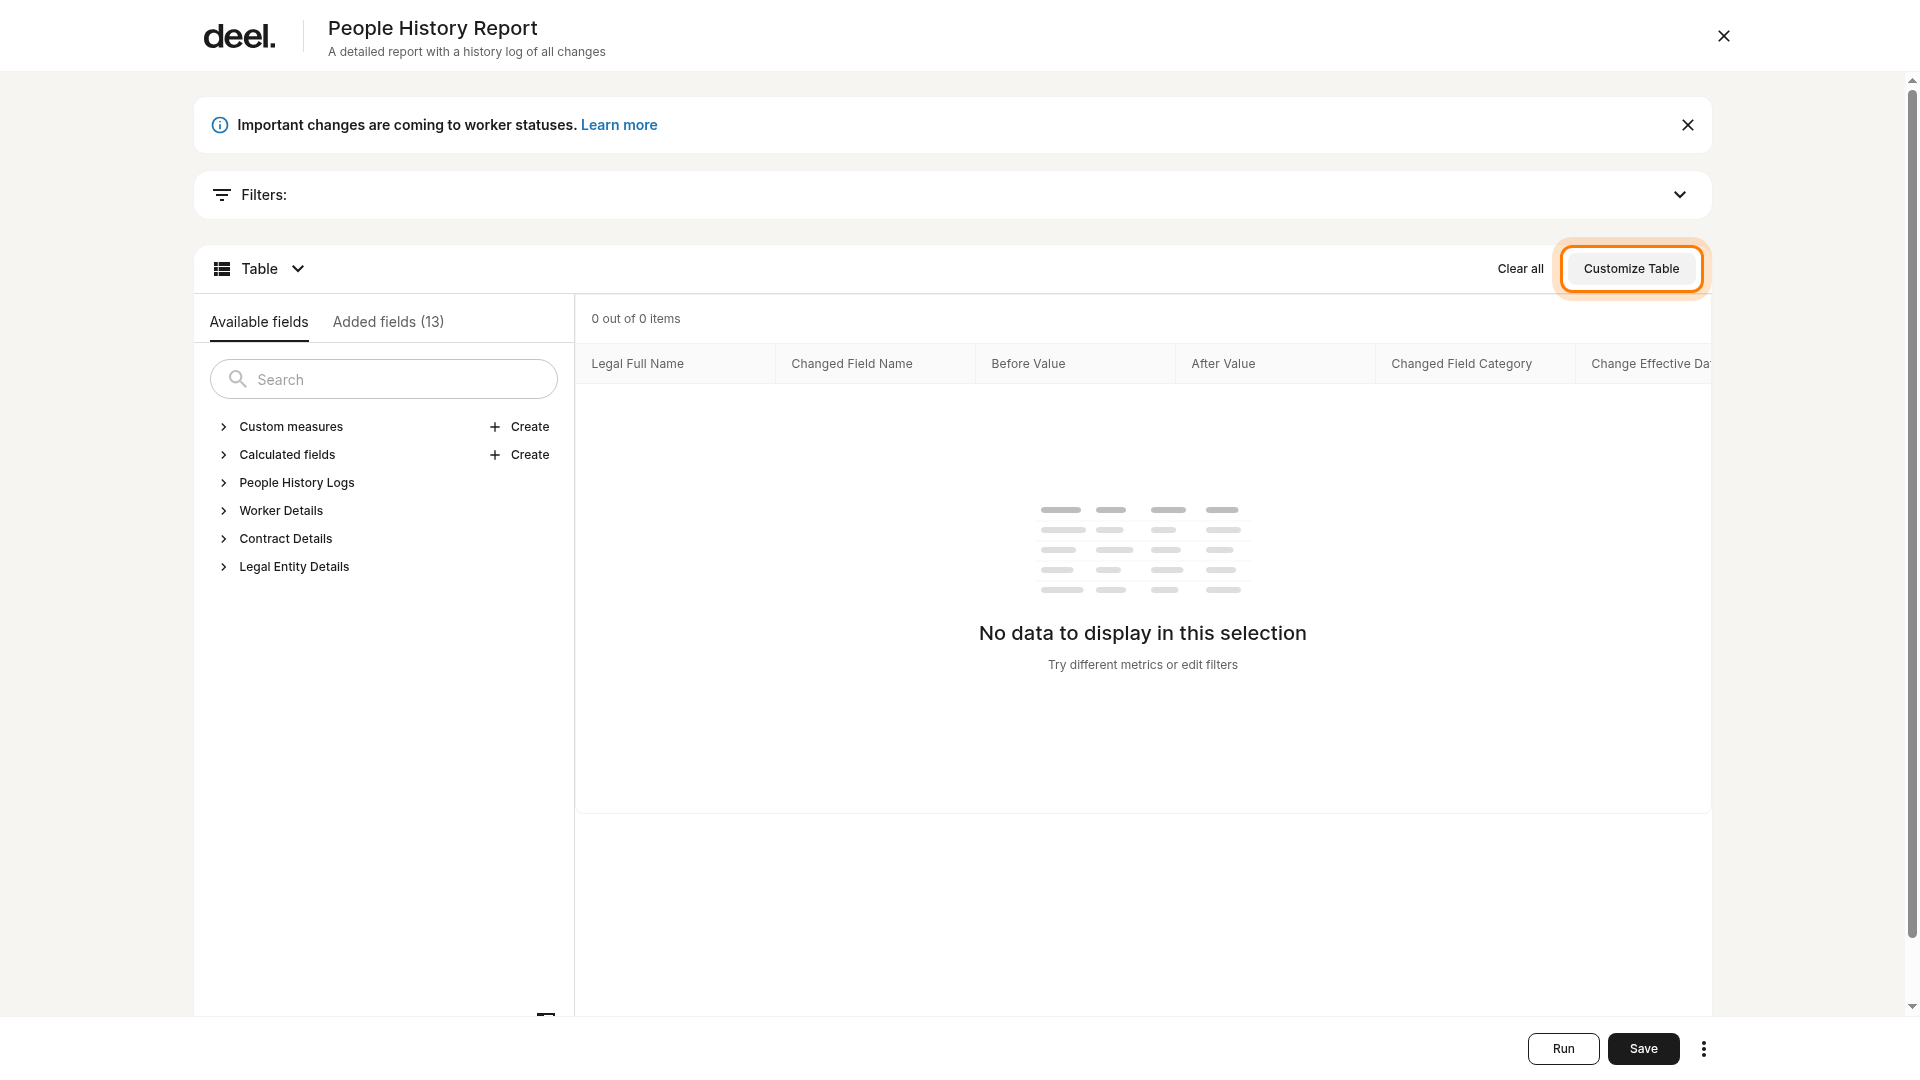
Use the right-side Customize table panel to adjust the available table configuration options. Save the report if you make changes.
Frequently Asked Questions
[ACCORDION] Can a One-time Report be shared with others?
No, a One-time report cannot be shared with others through the platform. The option to share a report will be available only if the report type is set to "save to dashboard".
[ACCORDION] Can an existing custom report be edited?
Yes, clients can edit a custom report after it has been created. To edit the report, go to Analytics > Reports and select the desired report name. The report builder opens directly in edit mode when you have the required edit permission; look for editable controls such as Filters, Available fields, Run, and Save. A separate Edit Report button may not be shown.
[/ACCORDION]